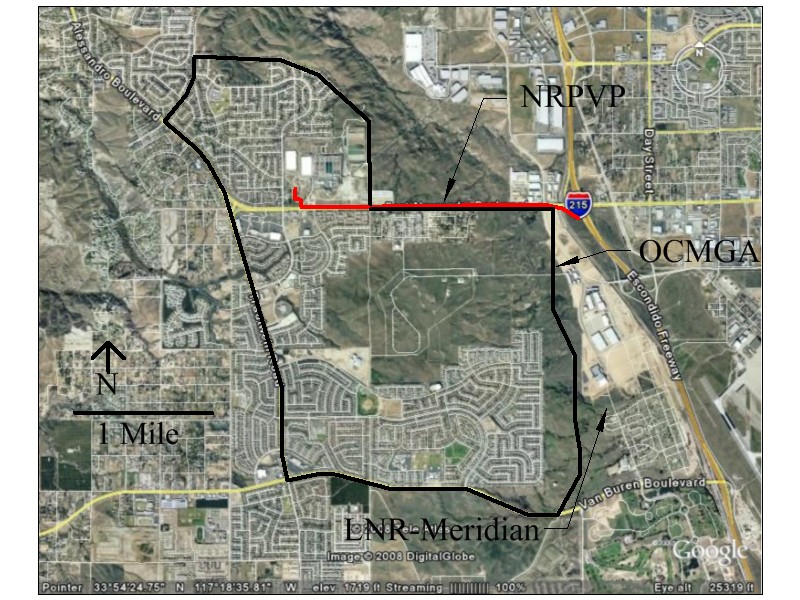
During and following groundwater investigations conducted in support of construction of the KIA Distribution Center ("LNR-Meridian", 2007) and the Metropolian
Water District's North Reach Perris Valley Pipeline ("NRPVP", 2008-2009) adjacent to the Orange Crest - Mission
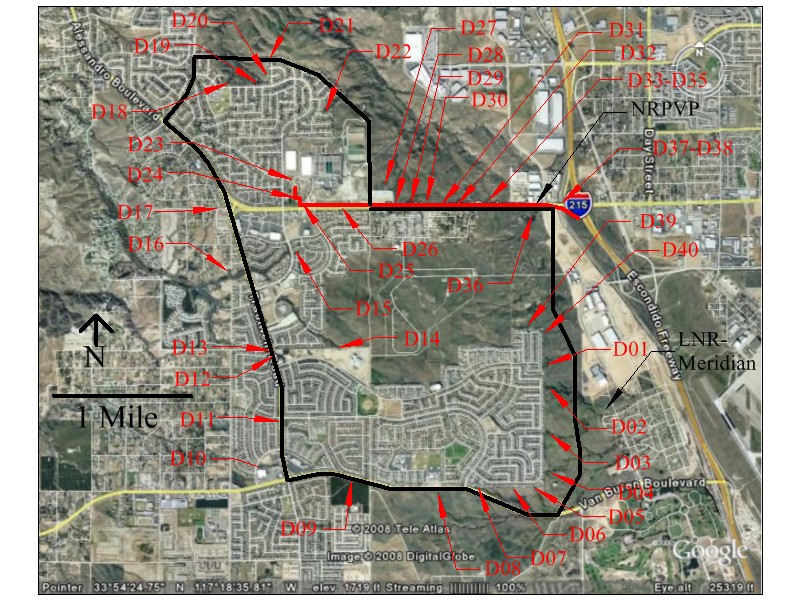
Grove area (OCMGA) of Riverside CA (see Figure 1 link below), the surface water discharge rates of forty (40) radially-oriented
drainages originating from the OCMGA (Figure 2) were visually estimated on an annual schedule from 2008 to 2012. The
drainages apparently receive runoff residential/business landscape irrigation water originating from the OCMGA via yard drains, curbs/gutters,
and receptor storm drains that discharge to the drainages (Figure 3). Estimates were conducted during July of each
year to reduce the influence of each preceding rainy season and during the afternoon hours to reduce the influence
of assumed morning mass landscape irrigation, resulting in the collection of daily drainage surface water "base
flow" data. The noted projects and the OCMGA are underlain by in situ-derived alluvial sediments
that overlie a jointed shallow crystalline bedrock complex (Figure 4; Morton & Cox, 2001), into which paleochannels had
been eroded prior to current accumulation of alluvium. In addition, to save costs developers will typically install storm
drain alignments/outlets within existing drainages that, in this case, appear to overlie the noted paleochannels. The
OCMGA is a unique study area for landscape irrigation water overuse in that the shallow bedrock complex prevents the
downward percolation of water (visual loss) into deep aquifers that typically underlie large developed areas, and
instead, directs the water laterally outward via the noted paleochannels where it can be observed and quantified.
Furthermore, pre-construction geotechnical investigations of several areas within the OCMGA conducted during 1988
to 1990 did not indicate any appreciable volumes of groundwater in the vicinity of the drainages nor future storm
drains, even during relatively wet precipitation conditions that occurred between 1987 and 1990.
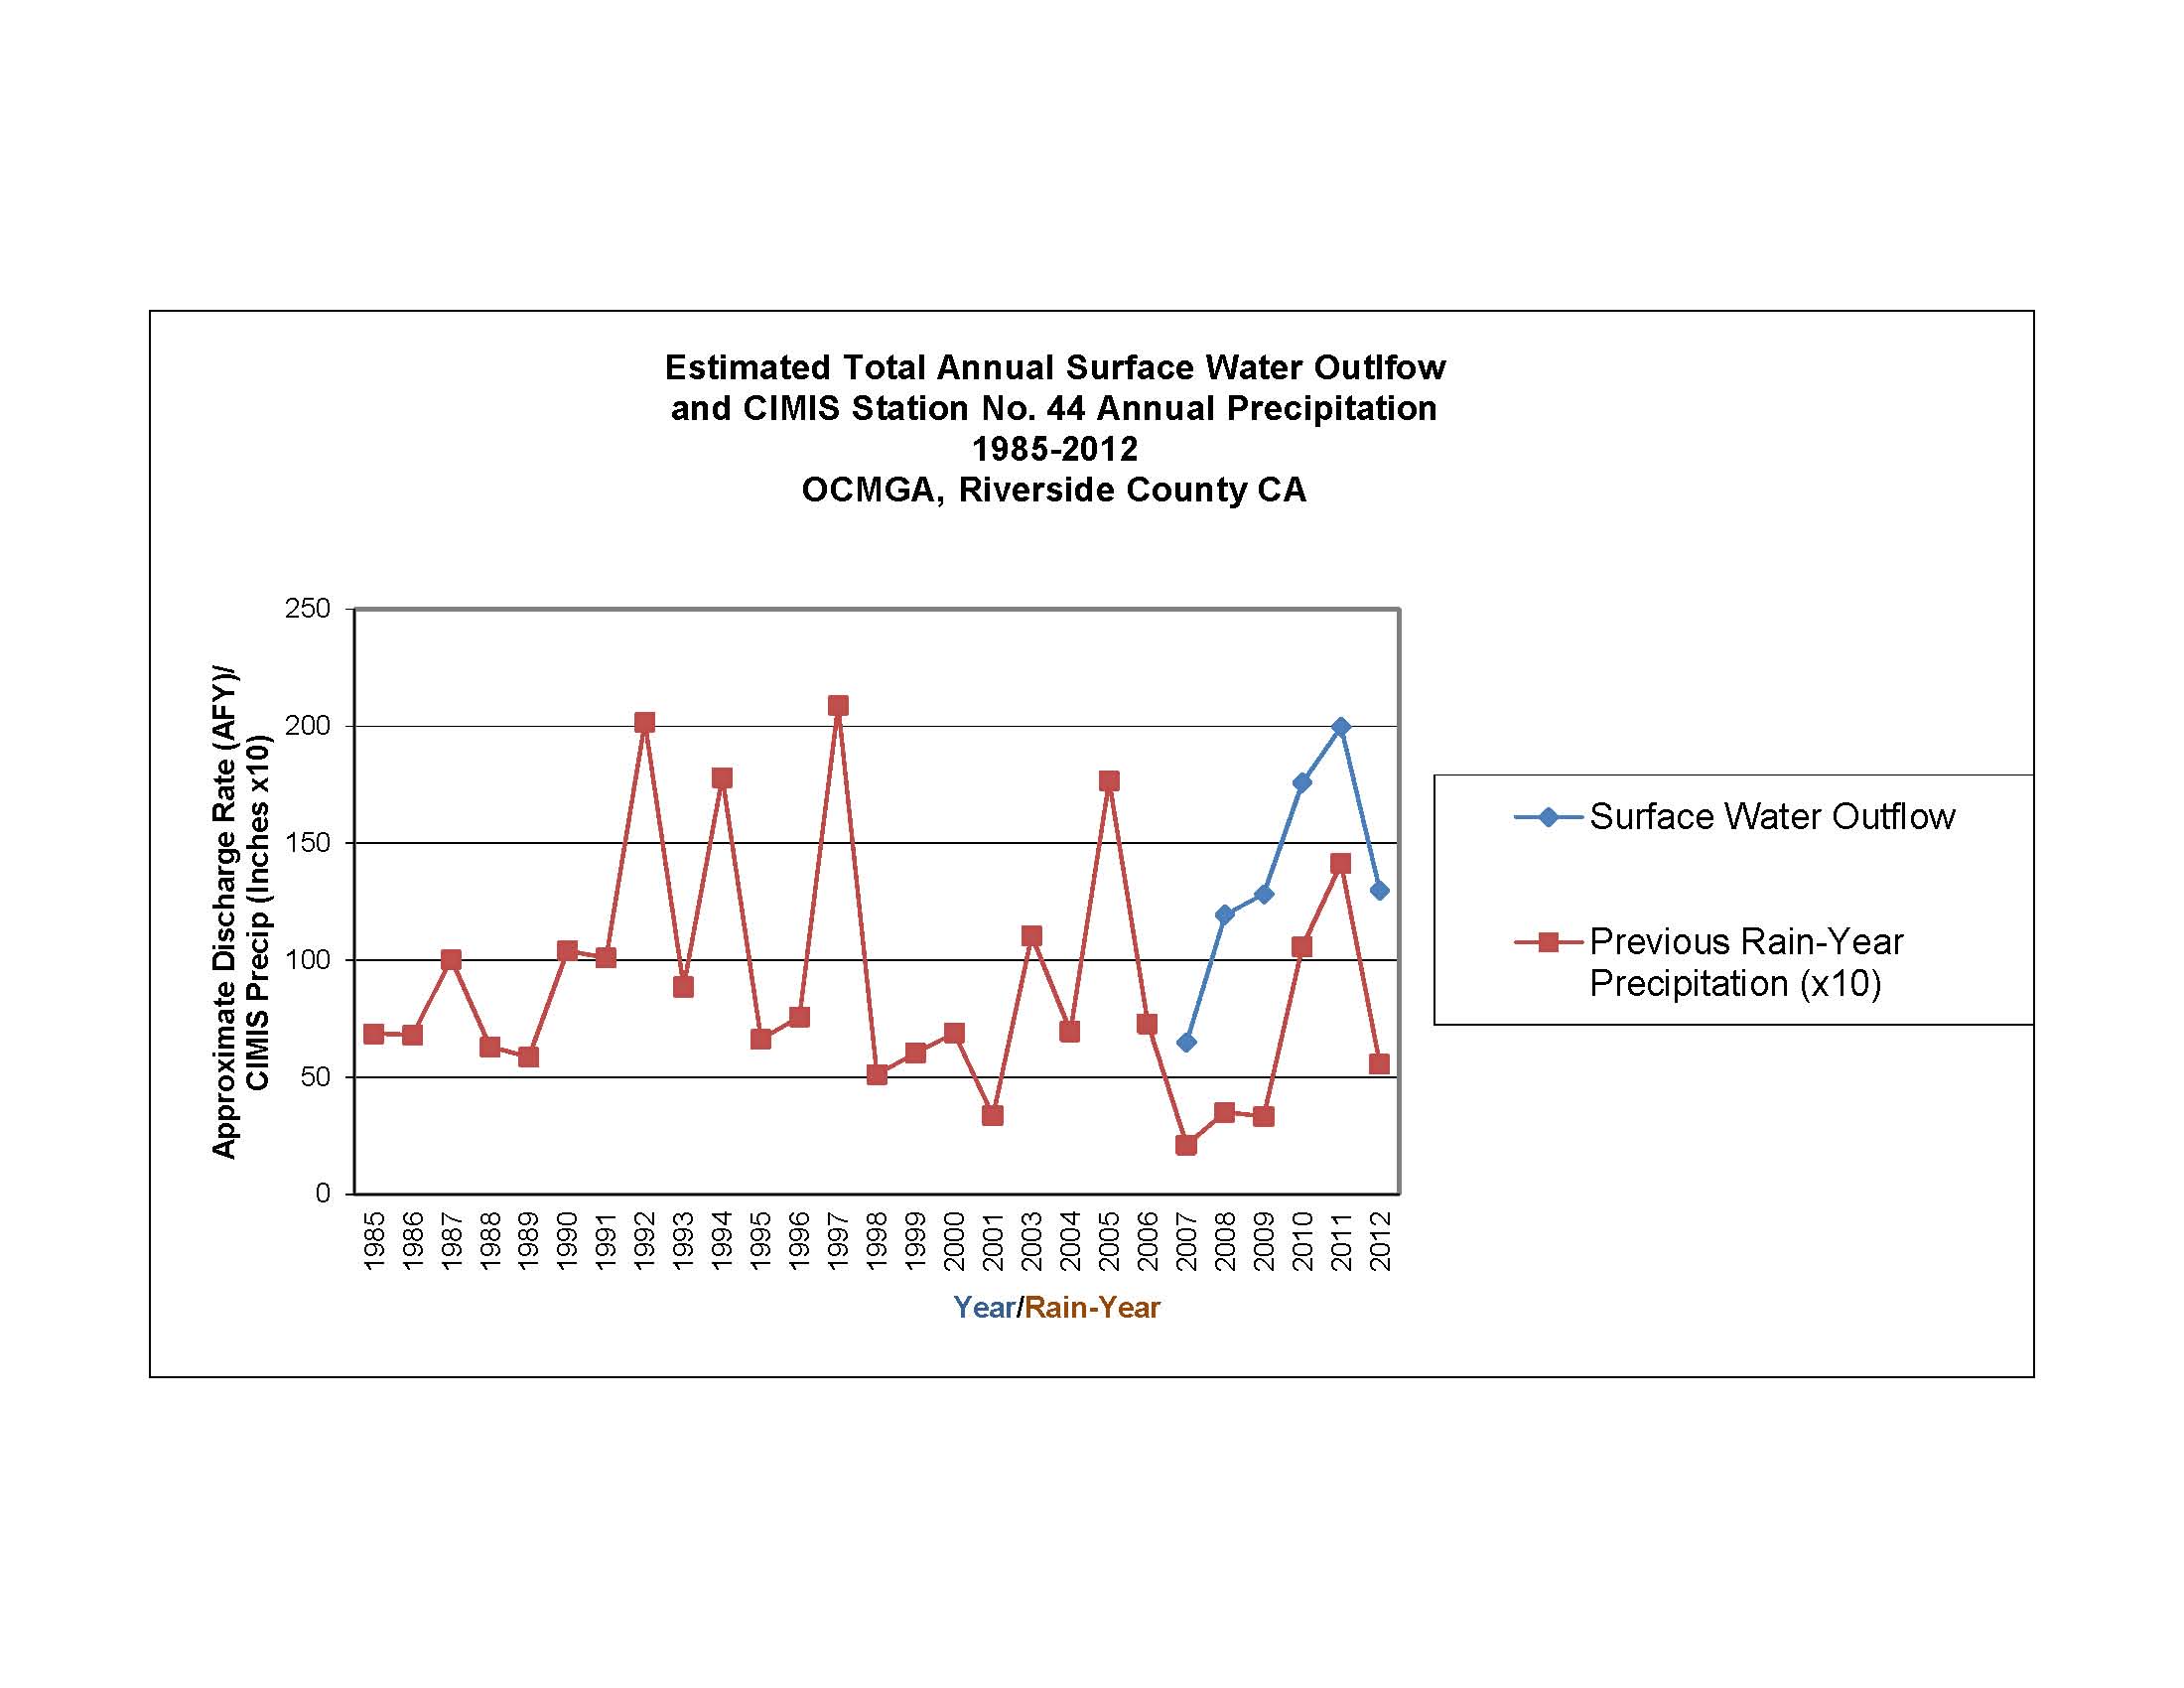
2008/2009 flow rates ranged between approximately
0.25 and 15 GPM (2008 total 74 GPM/2009 total 80 GPM), under drought conditions. Increased precipitation during 2010/2011
increased flow rates to a range between approximately 0.25 and 30 GPM (2010 total 109 GPM/2011 total 124 GPM), whereas decreased
precipitation during 2012 decreased flow rates to a range between approximately 0.25 and 20 GPM (2012 total 81 GPM).
These data indicate that 2008/2009 data corresponded to the latter portion of a multi-year region-wide drought, 2010/2011
data corresponded to a region-wide increase in precipitation, and 2012 data corresponded to a region-wide decrease in precipitation
(Figure 5). Thus, 2008/2009/2012 flow data may represent annual "base flow" landscape irrigation runoff conditions
for the OCMGA. Although Figure 5 indicates a much lower 2007 total flow rate, this total represents only the initial
four drainages (D01 through D04, Figure 2) that were estimated during the LNR-Meridian project, prior to the incorporation
of the remaining 36 drainages (D05 through D40, Figure 2) during the NRPVP project.
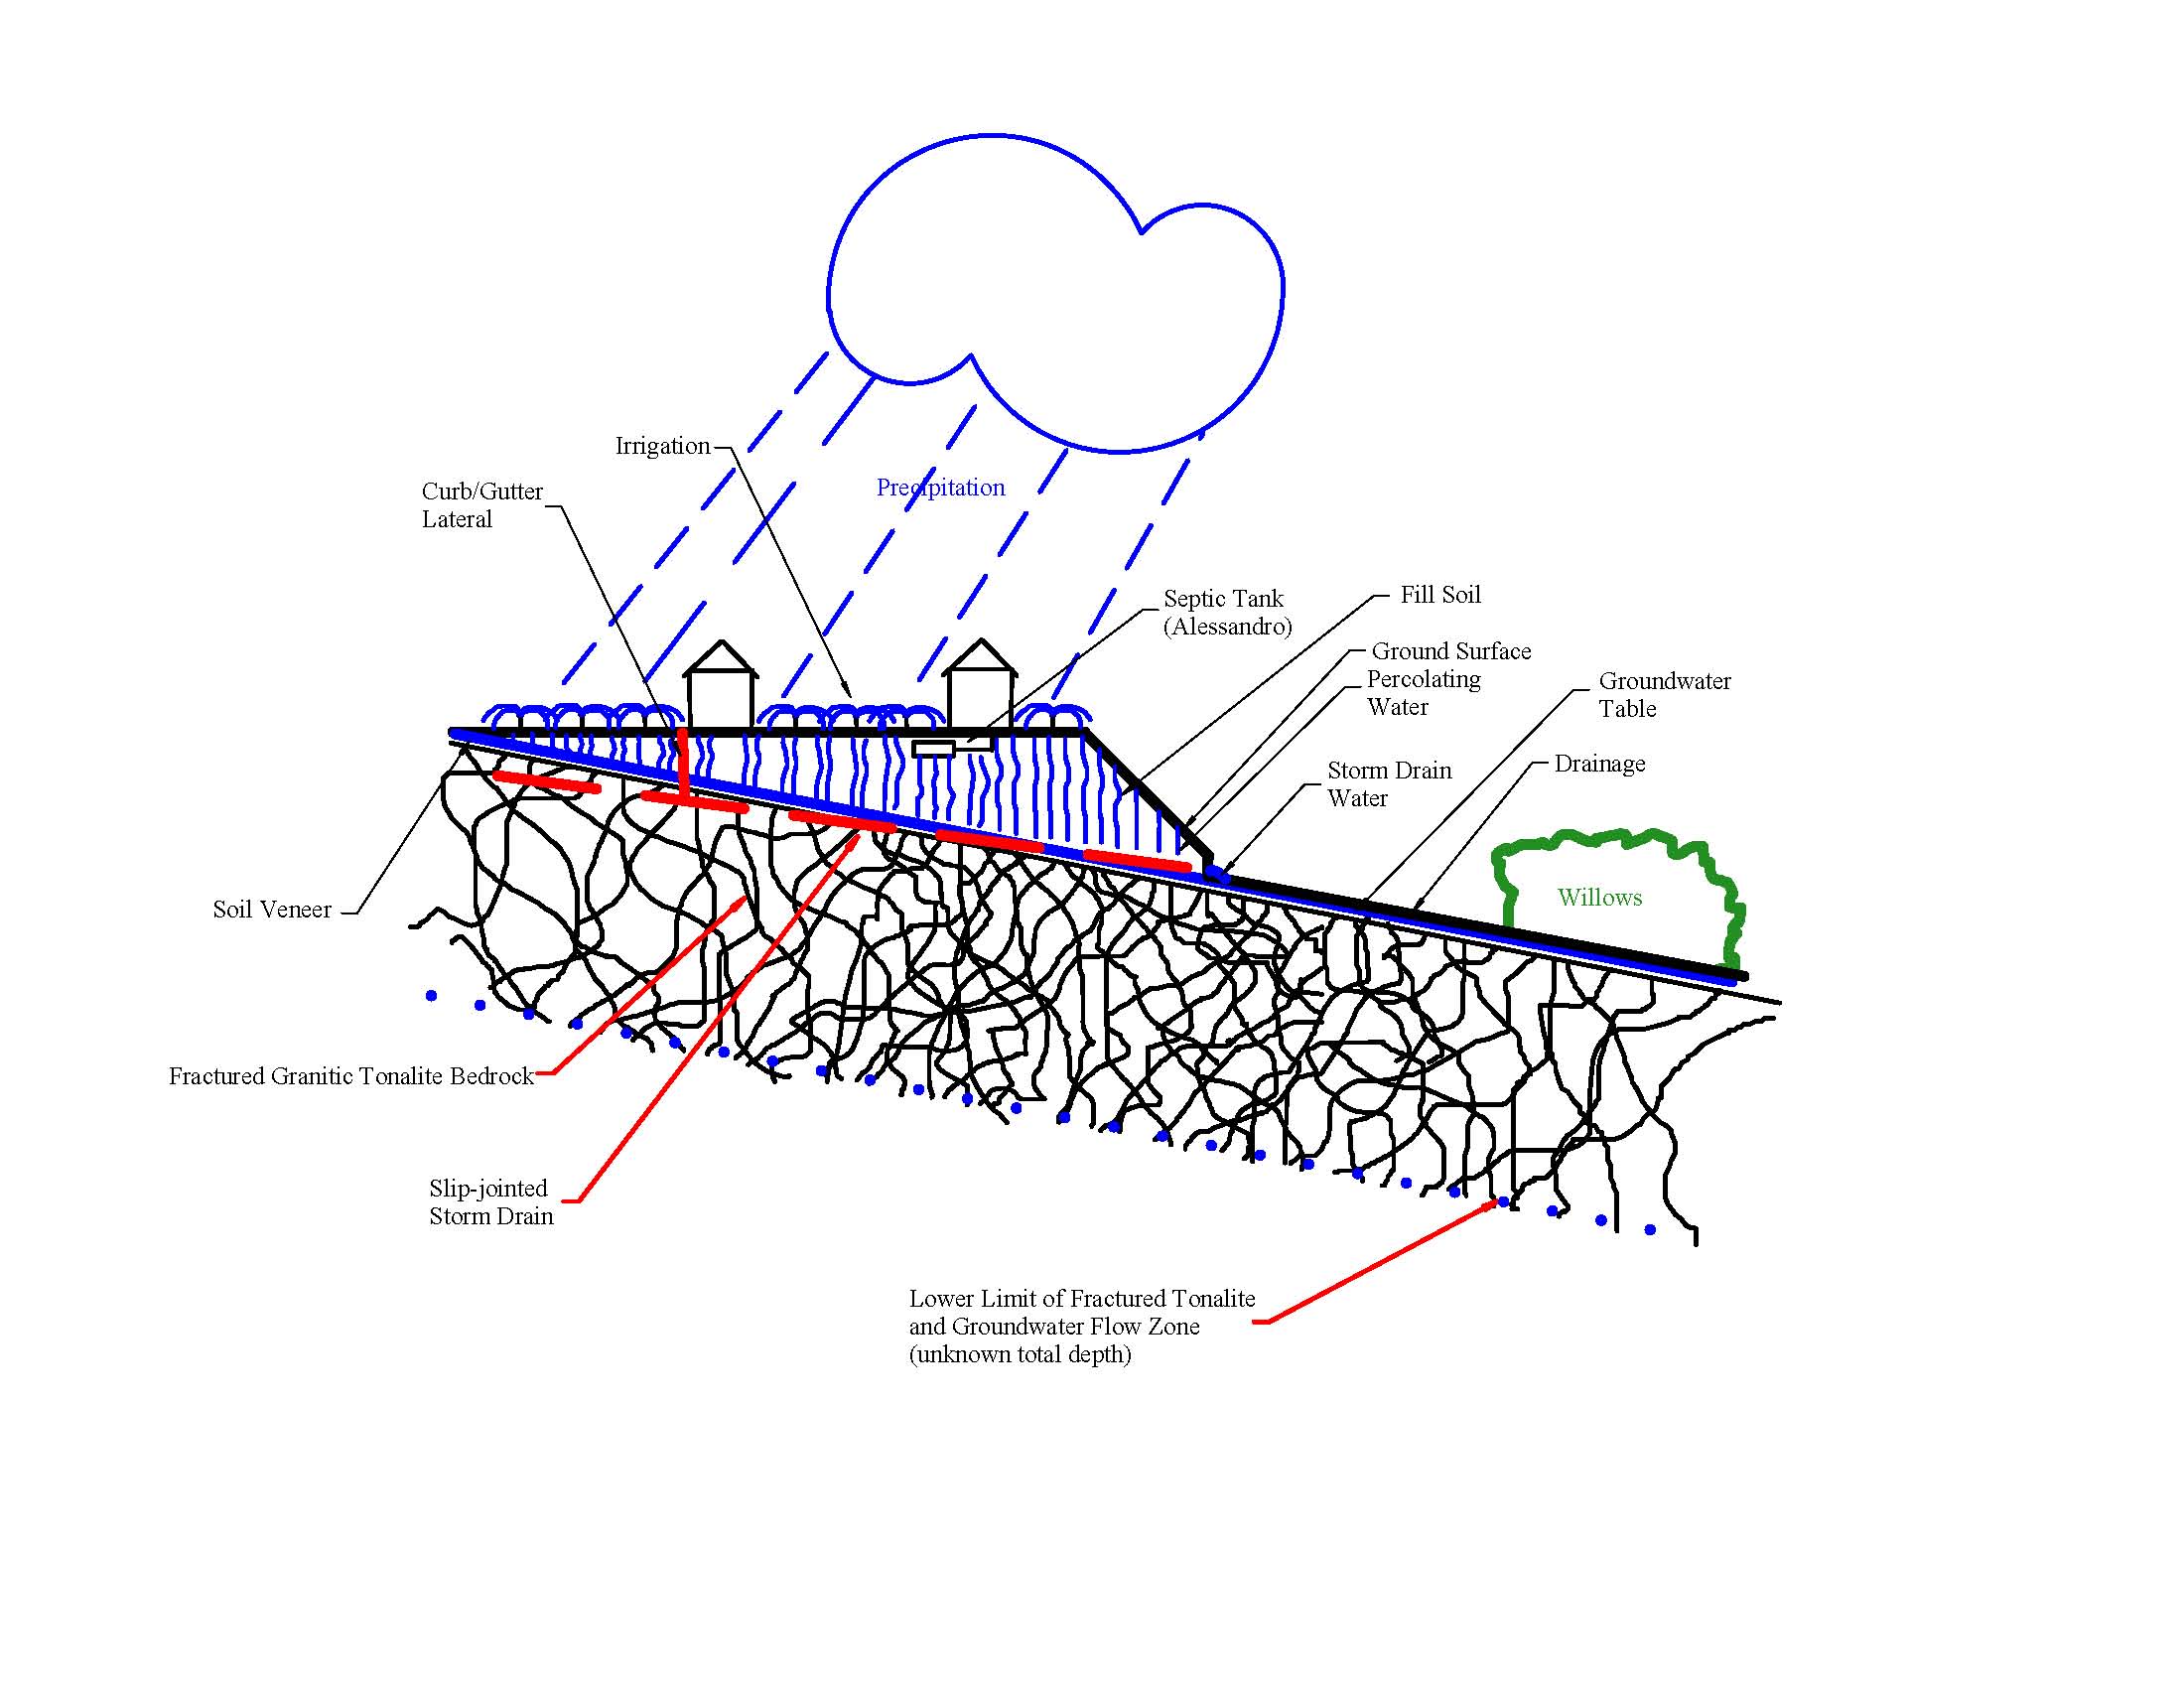
A conceptual model describing at least three (3) possible routes of landscape irrigation water to the
drainages has been developed (Figure 6). The routes are: (1) surface overflow into curb/gutter systems to drainages
via storm drains; (2) vertical downward percolation of water to buried interface between alluvium/bedrock complex, gravity
flow along interface toward/along paleochannel axes, perhaps entering slip-joints of buried storm drains; and (3) lateral
fracture flow of unknown portion of percolated water within uppermost portion of bedrock complex toward drainages, perhaps
entering slip-joints of buried storm drains.
Assuming that mass landscape irrigation occurs 365 days per year, the visually-estimated total annual flow volumes
originating from the OCMGA for 2008/2009/2010/2011/2012 were approximately 119/128/176/200/130 AFY, respectively, originating
from a potable water supply. In addition, historical aerial photographs dating back to 1938 indicate that the "base
flow" water originating from the OCMGA is anthropogenic, as shown by the establishment of "swamp" willows within
many of the noted drainages only after OCMGA development (landscape irrigation) within associated up-drainage areas.
California Department of Finance census data indicate that
the 2010 total southern California population within Imperial, Los Angeles, Orange, Riverside, San Bernardino, and San
Diego Counties was approximately 20,323,529 people. Using average per-county household sizes ranging from 2.75 (San
Diego) to 3.34 (Imperial) people per household, southern California had approximately 6,801,059 occupied households in 2010
within the noted counties. Assuming only 50% of these household irrigated landscaping with potable water, this results
in approximately 3,400,530 occupied households with such landscape irrigation. Using an OCMGA single-family/multi-family/commercial
connection-weighted "base flow" average of approximately 1.992E-02 AFY per connection, approximately 67,739
AFY (approximately 22,072,956,370 GPY) of potable water may be lost to landscape over-irrigation within the
noted southern California counties. This represents approximately 4.5% of the 2011/2012 MWD imported potable
water total volume (1.5 million AF or 488,776,500,000 gallons), at a loss of approximately $50,397,816.


